
The tool can help programmers visually measure, compare and analyze values that change over time. (This part was lazily copied straight from the product description page by the way).
Okay but what does it actually do?
Well the first part of the plugin keeps track of these graphs that you create (they automatically get created the first log call you do) and uses them to record values, both in memory (fixed amount) and also streamed to disk (endless) while your game is running.
While this is happening you can view these recorded values drawn as lines on a timeline in the editor window included in the package, the second part of the plugin.
Since the values are streamed to disk, after the game is stopped - all your recorded graphs will appear in a list which you can select and load in to look at in detail.
Why is this necessary? I can just use Debug.Log() to display a value, or use break points in the code and step through my code while I see what the values are. I can also just look at my inspector in Unity to see what the values of variables are at any time.
Well of course, you're absolutely right about that!
But let me give you a little back story as to why I created this tool and why it kept me from pulling out my hair while discovering some hard to find errors in my project.
So in this project I was working on (and still are) that's essentially a fighting game - not the standard 1 on 1 street fighter kind - but for the sake of this post It should give you a rough idea of what I'm talking about.
In this game I have a class that runs logic for a character that a player controls and this class has a LOT of states it can be in depending on if it's been hit, if it's on the ground, what animation is playing, how long a player holds certain buttons, etc. The list goes on.
So naturally there's a lot of timers being counted simultaneously, being constantly reset, sub states being turned on or off, and while in the middle of coding this thing I started having problem with a quick turn move the player could do to change direction while running causing the x velocity to spasm out for some unknown reason.
Because the amount of conditions this was relying on, I was having a really hard time figuring out what the heck was going on by just relying on the typical debugging methods.
Debug.Log calls would instantly become a cluster fuck because the sheer amount of calls flooding the console log, I had absolutely no idea where to look and for what number anomaly, so that was clearly not an option.
Using breakpoints to step though the code was also off the list, I had no idea when the conditions would become invalid and what method and calculation caused the problem.
So we are left with looking at the inspector trying to get a glimpse of what caused the anomaly. So while trying to play the game I kept my eyes looking at the inspector values frantically changing to see what was going on.
This also failed miserably, the timers had such short intervals that my eyes could barely could process the numbers being swapped per millisecond. Hmm - if that's the problem I'll just run the game in slow motion I thought! This was almost close too solving the problem but the new problem I was facing now was that I still didn't know exactly what to look for.
What was that value 3 frames before this? Did it change the expected amount in relation to that other timer that I saw was reset last frame? My memory could simply not keep track of all the little changes that happened each frame of the game. My memory is not that bad, just try to keep track of 5 of these "0.0019584" type's of values yourself! It's not that easy.

Well then I thought, what now? Should I just go through the code line by line and try to process the math in my brain with hypothetical numbers?
Then I remembered this article I read a while back about debugging using 'graphs' or something...
After a quick search I rediscovered this article, and after reading it I started coding on what was a very simple tool based on what I just read.
In the first version I tried using the web page approach, not even considering that I could use the editor to directly draw the graphs inside Unity. It was very cumbersome to use. I couldn't really see the graphs while the game was running. I had to stop the game, refresh the page and then try to analyze the graphs based on my latest run.

It suddenly hit me that why wouldn't I just use the wonderful editor and just code an extension so I don't even have to do these steps at all!
Then after some more tinkering it just came to me that this was simply meant to be shared, so it was clear that I should put this on the asset store so others could gain from this as well.
After some tweaking, some polish and even more tweaking I had the first version ready and now it's my first release on the asset store. Im very happy of how it turned out :)

I hope you will find this tool useful for your own projects and that it will save you from similar situations as I was in. I'm sure almost all game projects could seriously benefit from having the tool at their disposal (but then again, I'm obviously quite biased about this so I shall wait for reviews and see what people think).
- EDIT
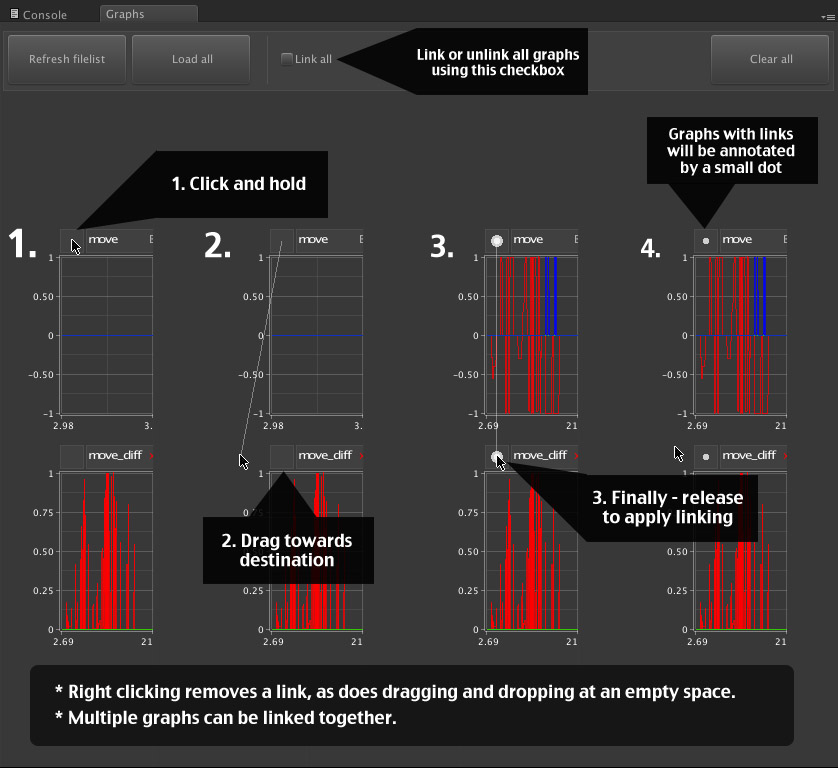
New to version 1.1 is a feature called graph linking:

Thanks for reading, and as a final note, thanks Herman Tulleken for writing such an excellent article!
No comments:
Post a Comment